How to Read RSI for Better Stock Entry Timing (Beginner’s Guide)
When beginners first start trading or investing in stocks, one of the biggest challenges is timing the entry and exit. Many people buy a stock after it has already gone up a lot, only to see it pull back shortly after.
This is where technical indicators can help.
One of the most widely used and beginner-friendly indicators is the Relative Strength Index (RSI). RSI helps traders understand whether a stock may be overbought, oversold, or trading in a balanced zone.
The goal isn't to predict the future perfectly, but to improve the probability of making smarter decisions.
In this guide, we'll break down RSI in simple terms and show how beginner traders can start using it for swing trading and better entry timing.
What is RSI?
RSI stands for Relative Strength Index.
It measures how fast and how strongly a stock's price is moving compared to its recent history.
The indicator ranges from 0 to 100 and helps identify whether a stock may be overbought (too much buying) or oversold (too much selling).
Most trading platforms such as TradingView automatically calculate RSI and display it as a line chart beneath the price chart.
How RSI Works (Simple Explanation)
Without getting too technical, RSI compares:
- Average gains over a period of time
- Average losses over the same period
The most common setting is 14 periods (usually 14 days on daily charts).
If recent price gains are stronger than losses, RSI rises.
If losses dominate, RSI falls.
This creates a momentum gauge that shows how strong buying or selling pressure currently is.
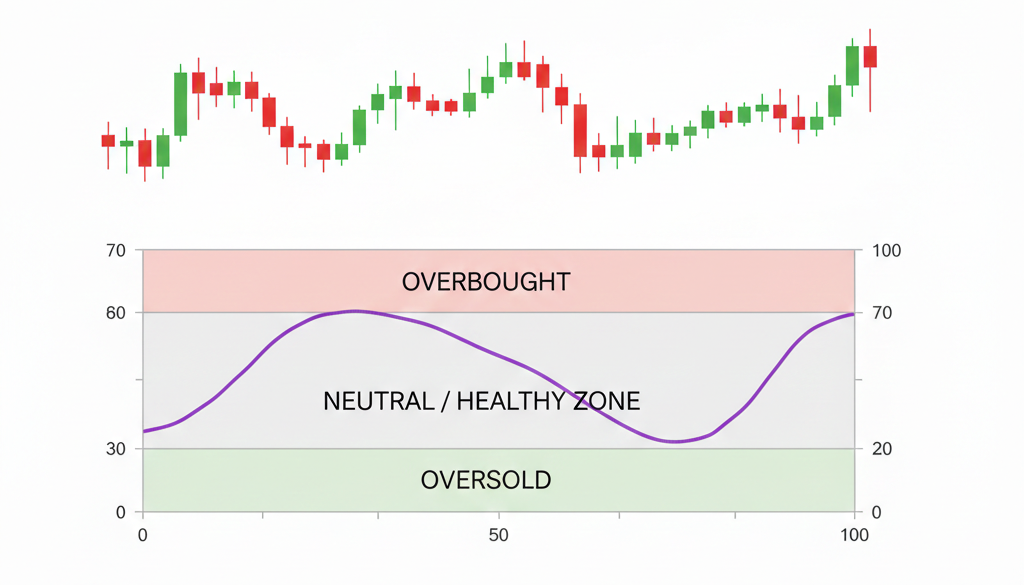
RSI Above 70 – Overbought
When RSI moves above 70, it suggests the stock may be overbought.
This means the stock has risen quickly and buying pressure may be temporarily exhausted.
What this could mean:
- The stock may pause or pull back
- Traders may take profits
- Momentum may slow down
If RSI moves above 80, the stock is considered extremely overbought, and the probability of a short-term correction increases.
However, strong stocks in powerful trends can remain overbought for extended periods.
This is why RSI should never be used alone.
RSI Between 40–60 – Neutral Zone
When RSI is between 40 and 60, the stock is in a neutral zone.
This means:
- Buying and selling pressure are balanced
- The stock is consolidating
- No clear momentum advantage exists
This often happens when stocks are building a base before the next move.
Many traders prefer to wait until RSI moves out of this zone before taking action.
RSI Below 30 – Oversold
When RSI drops below 30, the stock is considered oversold.
This suggests that selling pressure may be overextended, and the stock could be due for a bounce.
Oversold conditions can sometimes present buying opportunities, especially if:
- The overall trend is still upward
- The stock is near a support level
- Volume begins increasing
But remember: oversold does not mean the stock will immediately reverse.
Stocks can stay oversold longer than expected during strong downtrends.
Put this into practice
Get live signals for the stocks you watch
SignalEdge scans RSI, MACD, SMA crossovers and support levels — and alerts you when a setup like this fires on your watchlist.
Try SignalEdge Free →How Swing Traders Use RSI
Swing traders often use RSI to identify potential entry and exit points.
A simple beginner approach looks like this:
Potential Entry Signals
- RSI moves below 30 and starts rising
- Price finds support near a moving average or support level
- Volume increases as the stock begins to bounce
This combination suggests selling pressure may be fading.
Potential Exit Signals
- RSI moves above 70
- Price becomes extended above moving averages
- Momentum begins slowing
At this point, traders may:
- Take partial profits
- Tighten stop losses
- Exit the trade completely if momentum weakens
RSI “Gotchas” Beginners Should Know
Like any technical indicator, RSI is not perfect.
Here are some important things beginners should remember.
Stocks Can Stay Overbought
Strong growth stocks can stay above 70 or even 80 RSI for long periods during powerful trends.
Selling too early can mean missing large moves.
Oversold Doesn't Mean Immediate Reversal
A stock can remain below 30 RSI for days or weeks during a downtrend.
This is why traders wait for confirmation signals, such as:
- RSI turning upward
- Price reclaiming support
- Increased buying volume
Use RSI With the Trend
RSI works best when combined with trend analysis.
For example:
In an uptrend, oversold RSI often creates good buying opportunities.
In a downtrend, overbought RSI often creates short-term selling opportunities.
This concept is often summarized by the famous trading saying:
“The trend is your friend.”
Using RSI for Long-Term Investing
RSI is not just for traders.
Long-term investors can also use it to improve entry timing.
Instead of buying a stock immediately, investors may wait until:
- RSI moves into oversold territory
- The stock pulls back to a major support level
- Momentum stabilizes
This approach allows investors to scale into positions gradually instead of chasing prices.
A Simple RSI Strategy for Beginners
Here is a basic framework beginners can follow:
Step 1: Identify the overall trend using moving averages
Step 2: Wait for a pullback in price
Step 3: Look for RSI near 30–40
Step 4: Enter when RSI begins rising again
Step 5: Take profits when RSI approaches 70+
This simple process helps traders avoid buying at emotional highs.
Final Thoughts
RSI is one of the most beginner-friendly technical indicators because it clearly shows when a stock may be stretched too far in either direction.
But remember:
No single indicator should ever be used alone.
The most effective approach combines RSI with:
- Trend analysis
- Support and resistance levels
- Volume confirmation
- Risk management
When used correctly, RSI can become a powerful tool for improving entry timing and avoiding emotional trades.
Put this into practice
Get live signals for the stocks you watch
SignalEdge scans RSI, MACD, SMA crossovers and support levels — and alerts you when a setup like this fires on your watchlist.
Try SignalEdge Free →