Technical Analysis for Beginners: A Practical Guide for Busy Swing Traders

Most busy professionals don’t have the luxury of staring at charts all day. Between meetings, deadlines, and family commitments, tracking the stock market can feel overwhelming. Yet the desire to grow capital through swing trading is very real.
That’s where technical analysis for beginners becomes powerful.
You don’t need to be a Wall Street analyst or a full-time trader to make informed entry and exit decisions. You just need to understand the basics of price action, trend, momentum, and support/resistance — and more importantly, know how to apply them efficiently.
The real problem isn’t lack of intelligence. It’s lack of time and structured guidance.
In this guide, we’ll break down technical analysis in simple terms, show how swing trading fits into a busy schedule, and explore how automation tools like SignalEdge can help simplify decision-making without turning trading into a second job.
What Is Technical Analysis?
Technical analysis is the study of price movements and volume to forecast potential future price direction.
Instead of focusing on financial statements or earnings reports, it answers one core question:
“What is the stock actually doing right now?”
At its core, technical analysis looks at:
- Price trends
- Chart patterns
- Volume behavior
- Momentum indicators
- Support and resistance levels
For swing traders — especially beginners — technical analysis provides a structured framework for timing entries and exits.
Why Technical Analysis for Beginners Matters in Swing Trading
Swing trading focuses on capturing short- to medium-term price moves, typically lasting a few days to several weeks.
Busy professionals often struggle with:
- Entering too late after a big move
- Selling too early out of fear
- Holding too long during pullbacks
- Missing ideal entry zones
Technical analysis helps remove guesswork by providing objective signals.
For example:
- If a stock is above its 50-day moving average, the trend is likely bullish.
- If RSI is near oversold levels, momentum may be turning.
- If price is near strong support, risk can be defined clearly.
Without structure, decisions become emotional. With structure, they become strategic.
The Core Building Blocks of Technical Analysis
Let’s simplify the fundamentals.
1. Trend (The Big Picture Direction)
Trend answers: Is the stock generally moving up, down, or sideways?
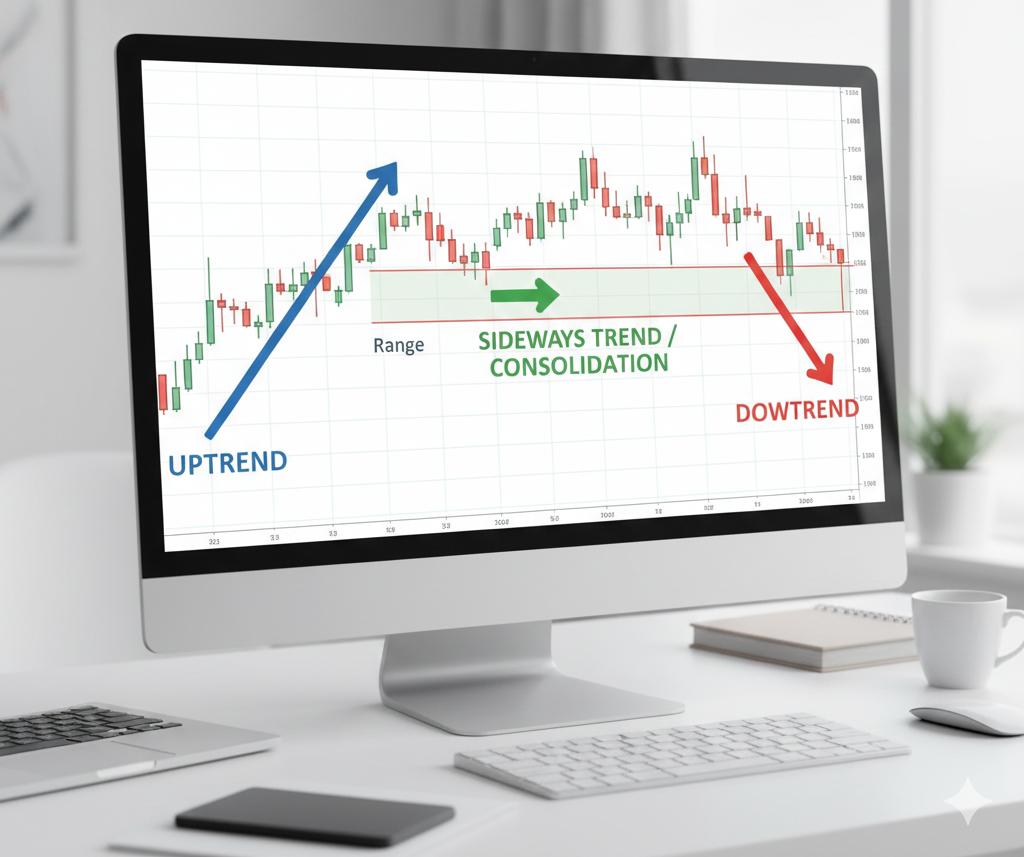
A simple method beginners can use:
- 21-day moving average → short-term trend
- 50-day moving average → intermediate trend
- 200-day moving average → long-term trend
If price is above all three, it suggests strength. If below, caution is warranted.
For busy professionals, this quickly filters which stocks deserve attention.
2. Support and Resistance (Where Price Reacts)
Support is where buyers historically step in.
Resistance is where sellers tend to appear.
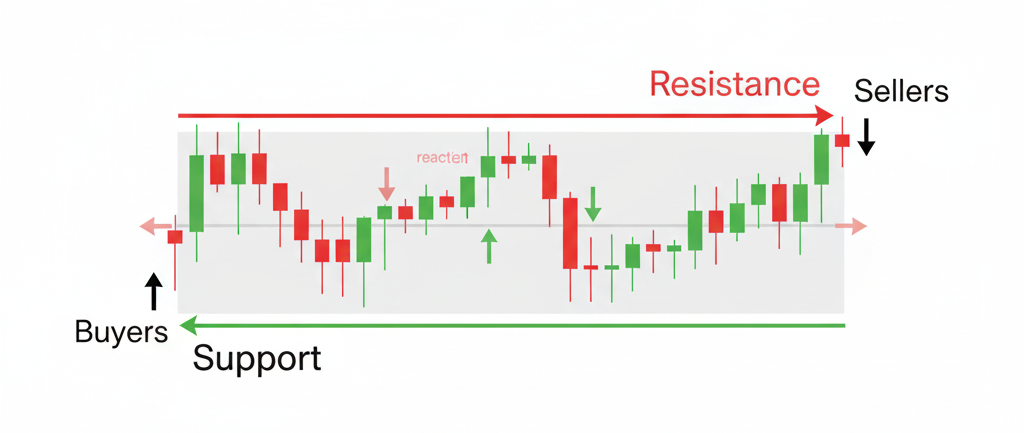
Imagine a stock repeatedly bouncing near $50. That level becomes support.
Swing traders often:
- Buy near support
- Sell near resistance
- Or trade breakouts above resistance
Timing improves dramatically when entries are made near these key zones instead of chasing price spikes.
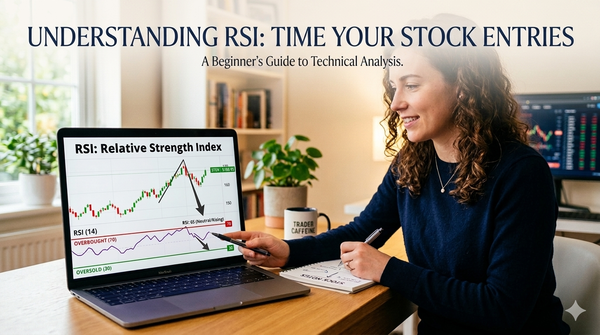
3. Momentum Indicators (RSI Made Simple)
The Relative Strength Index (RSI) measures momentum.
- Above 70 → potentially overbought
- Below 30 → potentially oversold
- Between 40–60 → neutral
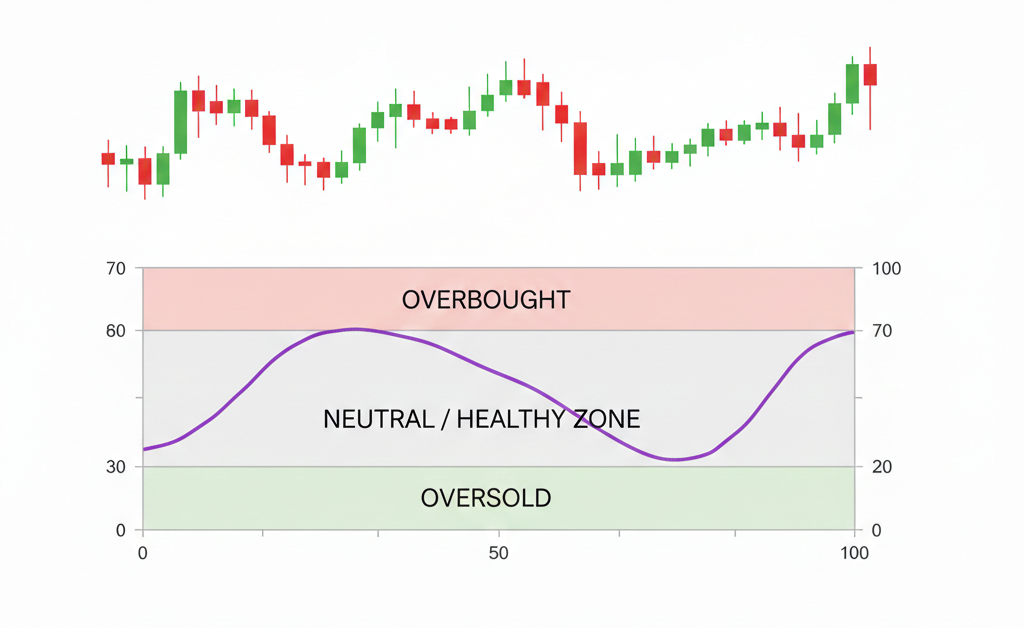
For swing trading beginners, a common approach is:
- Look for RSI pulling back toward 40–50 in an uptrend
- Avoid entering when RSI is extremely overbought
Momentum helps prevent emotional entries after large green candles.
4. Volume (The Confirmation Tool)
Volume confirms conviction.
If price breaks resistance with strong volume, the move has higher probability.
If price rises but volume decreases, momentum may be weakening.
Volume tells you whether institutions are participating — and that matters more than retail excitement.
The Real Challenge: Time and Consistency
Understanding charts is one thing.
Monitoring them daily is another.
Busy professionals often:
- Check charts randomly
- Miss ideal setups
- Enter late after work
- React instead of plan
Consistency is what separates disciplined swing trading from gambling.
But consistency requires structure and automation.
A Simple Technical Analysis Framework for Beginners
Here’s a practical checklist you can follow:
- Trend Check
Is the stock above the 50-day moving average? - Momentum Check
Is RSI between 40–65 (not overbought)? - Support Zone
Is price near support or recent consolidation? - Volume Behavior
Is volume increasing on up days? - Risk Management
Where is your stop-loss? Define it before entering.
This 5-step structure prevents emotional decisions.
However, manually repeating this process across multiple stocks daily can be exhausting.
Put this into practice
Get live signals for the stocks you watch
SignalEdge scans RSI, MACD, SMA crossovers and support levels — and alerts you when a setup like this fires on your watchlist.
Try SignalEdge Free →Automating Technical Analysis Without Losing Control
This is where tools like SignalEdge become useful — not as a replacement for learning, but as an efficiency multiplier.
Instead of manually scanning charts:
- Moving average trends can be flagged automatically
- RSI conditions can trigger alerts
- Support and resistance zones can be tracked
- Volume spikes can be highlighted
For busy professionals, automation means:
- Less screen time
- More structured decisions
- Reduced emotional trading
You still control your trades — but the heavy monitoring work is simplified.
Think of it as having a systematic assistant scanning the market while you focus on your career.
Common Mistakes Beginners Make in Technical Analysis
Let’s address reality.
1. Using Too Many Indicators
More indicators do not mean better decisions.
Keep it simple:
- Trend
- Support/Resistance
- RSI
- Volume
Clarity beats complexity.
2. Ignoring Market Context
Even strong stocks struggle in weak markets.
Always check:
- Is the overall market trending up?
- Is volatility elevated?
Swing trading works best when broader conditions support it.
3. Entering After Emotional Breakouts
A stock up 15% in one day looks exciting.
But often:
- Risk is elevated
- Stop-loss becomes unclear
- Pullback probability increases
Patience often provides better entries.
Technical Analysis for Beginners: A Sustainable Approach
If you’re a busy professional, your edge is not speed.
Your edge is discipline.
You don’t need:
- 20 trades per week
- Intraday scalping
- Complex derivatives
You need:
- High-quality setups
- Defined risk
- Consistent process
Technical analysis gives structure. Automation ensures you don’t miss opportunities.
Swing trading should complement your lifestyle — not dominate it.
Building Confidence Over Time
The goal isn’t perfection.
It’s improvement.
Start small:
- Track 5–10 stocks
- Journal your entries and exits
- Review what worked
Over time, pattern recognition improves naturally.
And when routine scanning becomes automated through platforms like SignalEdge, you free up mental bandwidth to focus on strategy instead of constant monitoring.
Final Thoughts
Technical analysis for beginners doesn’t have to be intimidating. At its core, it’s simply a structured way to read price behavior and make more informed decisions.
For swing trading busy professionals, the biggest obstacle isn’t knowledge — it’s time. By focusing on trend, support and resistance, momentum, and volume, you can build a repeatable decision-making process.
When combined with smart automation and alerts, the process becomes manageable, sustainable, and aligned with a full-time career.
If you’re looking to simplify your trading workflow, explore tools and educational resources that support structured decision-making. The right system won’t guarantee profits — but it will dramatically improve consistency and clarity.
And in trading, clarity is everything.
Put this into practice
Get live signals for the stocks you watch
SignalEdge scans RSI, MACD, SMA crossovers and support levels — and alerts you when a setup like this fires on your watchlist.
Try SignalEdge Free →